
University of Pennsylvania Weitzman School of Design
The District Department of Transportation (DDOT) wants biking to be safe, accessible, and easy for everyone, but measuring when and where people ride bikes is difficult. Together, the Lab and DDOT are combining multiple sources of ridership data to estimate how people use the city’s bike lanes and bike trails. This project will create a clearer picture of where people are riding bikes, how bike ridership is changing over time, and how it changes in response to interventions.
Why is this issue important in DC?
The District has a growing network of nearly 200 miles of bike lanes and paths. DDOT conducts yearly annual in-person counts of bike riders and has several automated counters on bike paths. DDOT also has data sources on how people travel using bikeshare and dockless scooters, such as Strava and Capital Bikeshare. This data offers a partial picture of bike ridership across the city and leaves many gaps that make it difficult to understand the impact of DDOT projects, assess crash risk, and plan for future projects.
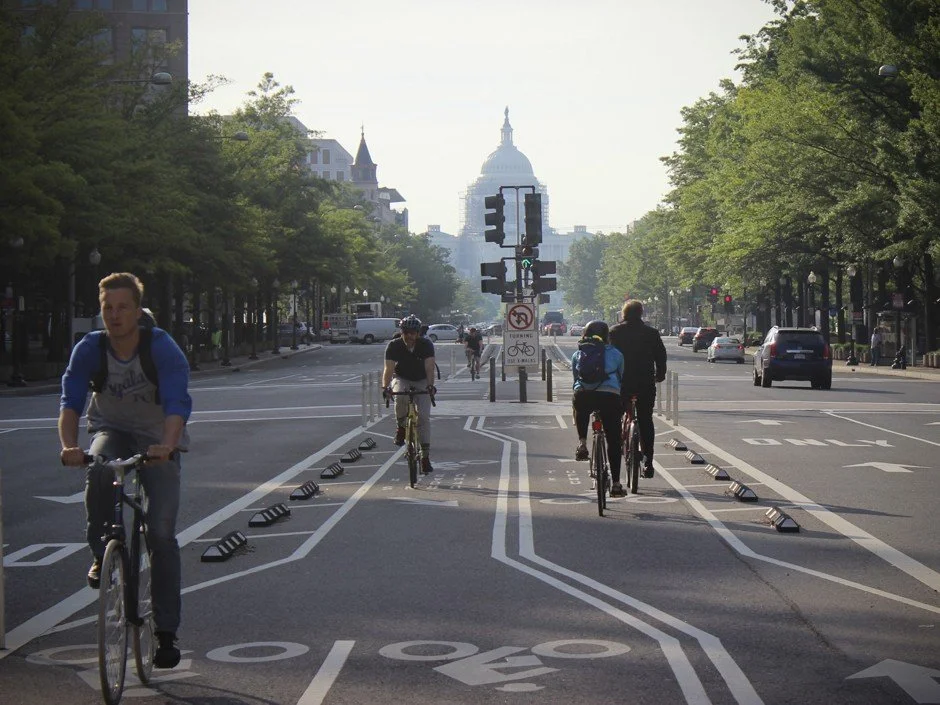
Riders on the Pennsylvania Avenue NW cycle track. (Photo Credit: Bloomberg)
What are we doing?
We are combining separate datasets to test a statistical model that estimates traffic on District bike lanes and trails. The model calibrates for the blind spots of each data source and cross-references datasets to fill in the gaps. For example, the automated counters give a full count of riders across time but only looks at one segment of a path, and the in-person counts only look at one day of the year. Some datasets may include more commuters, more leisure cyclists, or more casual e-bike riders. By combining them, we can gain a more complete picture of ridership.
Because some data sources may be more or less likely to include certain users and certain locations, we’ll also check how well the model performs for different neighborhoods of the District. This will help us understand the gaps in the model and who we may be missing.
What have we learned?
We expect to share results by the end of 2026.
What comes next?
We are working with stakeholders across DDOT to map out how ridership counts would be used to evaluate projects and to plan for new bike infrastructure. We will provide count estimates for recent years, as well as a model that can produce new estimates as new count data comes in.
What happened behind the scenes? Through a partnership with the University of Pennsylvania, we worked with students on the first phase of the model development. We will build off of their model, look at how well different models work, and identify what matters most for accurate predictions.