
A bus shelter can offer a place for riders to sit while they wait and offers protection from rain, wind, and sun. The District Department of Transportation’s (DDOT) long-term transportation plan—MoveDC—includes improvements to bus shelter infrastructure. Currently, areas with fewer bus shelters tend to have more bus dependence, hotter temperatures, and a greater concentration of low-income residents. To counter these gaps, DDOT gathered feedback on where riders need shelters most and developed a model to rank stops based on that input. We heard that shelters are needed most where there are high concentrations of seniors and residents with disabilities. The resulting model distributes more shelters to areas that currently have the fewest, and it does so more quickly than if shelters were prioritized just on ridership. The model will inform future bus shelter distribution planning.
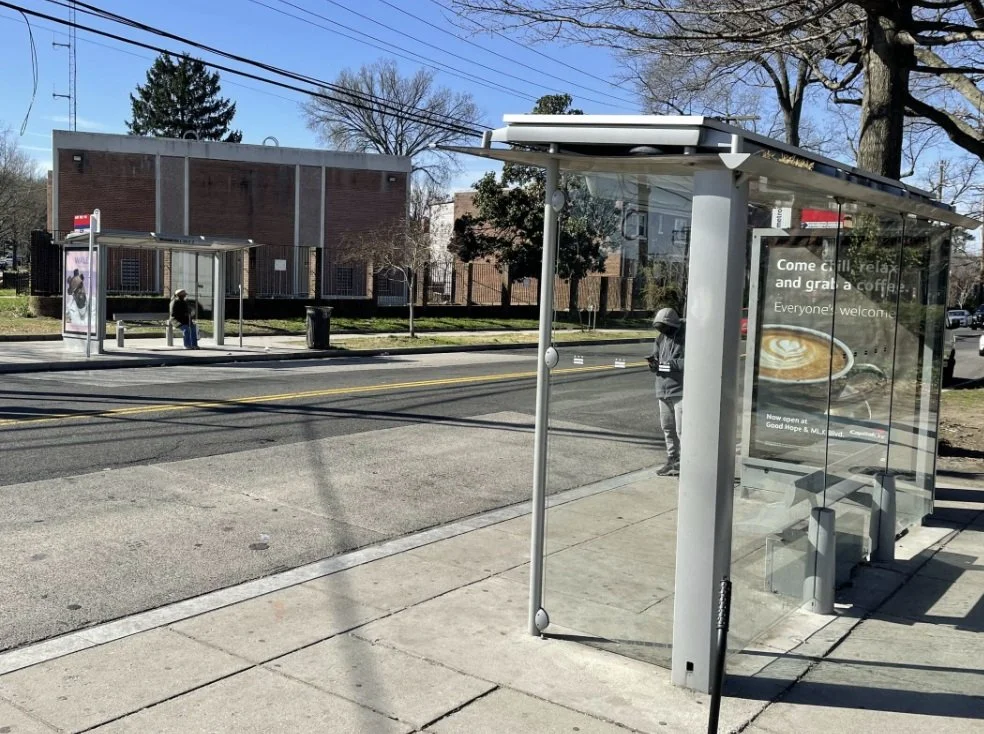
People waiting for the bus at a sheltered stop. (Photo credit: DDOT Bus Priority Team).
Why is this issue important in DC?
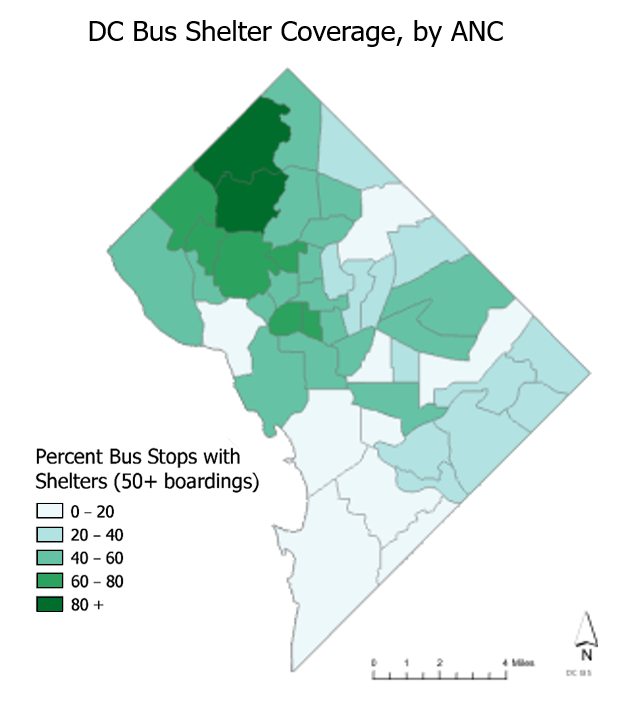
Since 2005, bus shelters in DC have been installed and maintained by a private company through a franchise agreement. The company collects a portion of the ad revenue shelters generate. Since shelter placement has historically been influenced by revenue considerations under this franchise structure, shelters have been disproportionately placed in higher income areas and along business corridors. Meanwhile, over half
of Metrobus riders are low-income, and low-income populations are more likely to live in hotter areas where waiting for the bus in the heat can have negative health effects for vulnerable populations. As of April 2026, roughly 615 DC bus stops—or 25%—were sheltered.
What did we do?
We developed a scoring tool to prioritize bus stops in the District to get a shelter. We started by talking to 40 bus riders where they are—at bus stops, senior wellness centers, libraries, and service centers—to hear what matters to them among several factors:
- Demographics: age, income, and ability of the people who live near the stop;
- Ridership: on average, how many people wait at the stop and for how long; and
- Demographics: the stop’s proximity to grocery stores, schools, healthcare, and public facilities.
These short interviews took place throughout the District to reflect different neighborhoods, income levels, rider levels, and existing shelter conditions. Unfortunately, the interviews only took place in English, because riders were actively using transit and arranging for interpretation in that setting was not feasible. This is a limitation that should be addressed in future research. We also interviewed transportation staff to inform how we constructed the prioritization model. What we heard helped us decide which data sources to include and how much weight to give to each.
What did we learn?
At bus stops across five wards, riders told us that access to destinations and the demographics of the neighborhood were the most important factors for selecting bus stops to shelter. Fewer than half ranked ridership and wait times as most or somewhat important. To better understand these priorities, we had in-depth conversations with residents at a senior center, a library, and a service center. We heard that:
- Shelters offer vulnerable riders a place to sit and protect them from the elements.
- The most vulnerable riders are older adults and people with disabilities.
- Sheltering stops that provide access to destinations that these riders need, such as doctors’ offices, grocery stores, and social services, is critical.
The model prioritizes areas of the city and specific stops based on the destinations served and the number of vulnerable riders who live nearby. To compare the model to the status quo, we simulated where shelters would go over the next 20 years using the model versus ranking stops by ridership. The model leads to more shelters sooner in the wards that currently have the fewest.
What comes next?
This model is a guide to help identify high‑priority areas, but DDOT staff will still review each stop and consider other factors, such as additional equity needs and revenue requirements, before deciding where shelters will go. The areas that most need bus shelters in DC will evolve over time. We’ll develop a user guide to support updates to the model to account for changing demographics, facility locations, and weather data.
What happened behind the scenes?
The research team walked through an area that the model ranked as a priority. Several bus stops in that area did not have enough space to build a shelter. We realized that some lower-income areas are more likely to have narrow sidewalks, obstructing shelter installation. To account for this, the model prioritizes stops within a neighborhood rather than ranking each individual stop. This means that when a priority stop doesn’t have enough space, another one nearby can get a shelter instead. Separately, DDOT’s Sidewalk Gap Program is making improvements that address access challenges and are fairly distributed across the District.